Proving my Rust NVR doesn't leak memory (it did)
Murlet, my macOS network video recorder (NVR), has to be utterly reliable: an NVR typically runs unattended for weeks at a time, and someone only interacts with it when they need to review an event. If in that moment they discover the NVR crashed three weeks ago... yep, that would be a deal-breaker for me too.
One pernicious source of in-the-field failures is data structures that slowly
grow without bound, especially those in third-party dependencies. These are
invisible to tools such as the macOS leaks command and the Clang
LeakSanitizer because the data
is still reachable. And when this growth is sufficiently slow, it can be
invisible during end-to-end testing, only causing memory pressure after weeks or
even months of uptime. (To keep things simple, I'm going to call this kind of
unbounded growth a memory leak.)
I set out to prove to myself that Murlet wasn't leaking memory, and discovered (horror of horrors!) that it actually was. This blog post is the story of how I found and fixed it. We'll cover:
- How I separated the Rust and Electron heaps so that the macOS
vmmaptool reports their sizes independently. - How I taught Murlet to gather and log its own versions of the memory metrics
that Activity Monitor and
vmmapshow, so that I can graph them over time. - How I used the
heapandmalloc_historytools to trace the leak to wgpu. - How I fixed the underlying issue. (And to be completely fair to wgpu, the leak only happens when repeatedly hitting an error path, and it's already gone from wgpu's trunk.)
There's a fair amount of ground to cover here, so I'm going to gloss over some of the implementation details.
Separating the Rust and Electron heaps
As discussed in my previous blog post, Murlet comprises an Electron frontend and a Rust backend, implemented as a native Electron plugin. Electron's Chromium core uses a shim to divert all memory allocations to its own PartitionAlloc allocator. Murlet's Rust backend runs in the same address space as the Electron frontend, and therefore by default all Rust allocations also use PartitionAlloc.
This makes it hard to disentangle Rust and Electron memory footprints: the PartitionAlloc shim routes every allocation into a single shared partition, losing each allocation's provenance. I could have recovered it using Chromium's heap profiler, which logs call stacks of sampled allocations. But that tooling is built for one-off investigations, where you already suspect a problem. I wanted metrics I could leave on in the field, and graph as part of a pre-release soak test.
What to do about this? First a brief detour into
libmalloc, Apple's
system allocator. This has the built-in concept of zones: buckets
which applications can direct specific allocations into. Significantly, zones
are surfaced across the standard macOS debugging tooling. vmmap reports each
one separately, and heap and malloc_history can inspect their contents.
The zone-aware API is straightforward: create and name a zone
(malloc_create_zone, malloc_set_zone_name), then allocate through
zone-flavored versions of malloc, calloc, realloc and free. I replaced
Rust's global allocator with a thin layer over this API. It creates a dedicated
murlet_rust zone and routes every Rust allocation into it. Since Chromium's
shim
only intercepts the default zone,
these allocations bypass PartitionAlloc entirely. It's not magical: about 150
lines of Rust to implement std::alloc::GlobalAlloc, and a similar amount of
test code.
Three asides:
- Replacing the global allocator is a smaller change than it might sound: in an
ordinary macOS process, Rust's default
Systemallocator is already libmalloc (malloctargets the default zone), so we're just pointing the allocations at a named zone instead. - Rust's allocator API lets callers request any power-of-two alignment, but
malloc_zone_malloc, like plainmalloc, only guarantees 16 bytes. For larger alignments there'smalloc_zone_memalign, but no alignedcallocorrealloc, so I fill those gaps by hand, zeroing and reallocating by copy. Rust's ownSystemallocator plays the same tricks. - Building on libmalloc (as opposed to using a bundled allocator such as
jemalloc or mimalloc) also gives me sanitizer coverage:
AddressSanitizer
interposes the
malloc_zone_*functions, so when I periodically run Murlet's tests under ASan, it still checks every Rust allocation.
With the zone allocator in place, pointing vmmap at a running Murlet
instance shows the Rust heap as its own row. For leak hunting, we care about
the "BYTES ALLOCATED" figure: these are the bytes that Rust is actually
holding (its live bytes).
murlet_live555 is a separate zone that I added to track allocations from
live555, the C++ library that Murlet uses
for RTSP. Fragmentation ("% FRAG") is a story for another time.
$ PID=`pgrep -f /Applications/Murlet.app/Contents/MacOS/Murlet`
$ vmmap -summary $PID
                                          VIRTUAL   RESIDENT      DIRTY    SWAPPED ALLOCATION      BYTES DIRTY+SWAP          REGION
MALLOC ZONE                                  SIZE       SIZE       SIZE       SIZE      COUNT  ALLOCATED  FRAG SIZE  % FRAG   COUNT
===========                               =======  =========  =========  =========  =========  =========  =========  ======  ======
[...]
murlet_rust_0x109f24000                     38.1M      36.1M      36.1M        96K      48294      18.3M      17.9M     50%      24
murlet_live555_0x13b10c000                  15.0M      3376K      3376K         0K         15      15.0M         0K      0%       5
What about Electron's C++ heap, which also used to contain Rust's allocations? Chromium tags PartitionAlloc's memory regions with a dedicated constant, defined in its PageTag enum:
enum class PageTag {
  // ...
  kPartitionAlloc = 253,  // PartitionAlloc, no matter the partition.
  // ...
};
And sure enough, there it is as "Memory Tag 253" further up in the same vmmap
report. The 48.0G virtual size is PartitionAlloc's up-front address-space
reservation; its actual footprint is the sum of the "DIRTY SIZE" and "SWAPPED
SIZE" columns (pages it has written to).
                                VIRTUAL RESIDENT    DIRTY  SWAPPED VOLATILE   NONVOL    EMPTY   REGION
REGION TYPE                        SIZE     SIZE     SIZE     SIZE     SIZE     SIZE     SIZE    COUNT (non-coalesced)
===========                     ======= ========    =====  ======= ========   ======    =====  =======
[...]
Memory Tag 253                    48.0G   327.4M   210.4M    2592K       0K       0K       0K     5333
This single anonymous row is all the visibility macOS tooling has into
PartitionAlloc. As we'll see in the rest of this post, the Rust heap's zone
is debuggable using standard tools such as heap and malloc_history.
Graphing memory over time
Now that we can see the Rust memory footprint, wouldn't it be nice if we could graph it over time? If it's flat we can sleep easy, and if it's up-and-to-the-right, well... you already know where this is going.
Murlet's Rust backend uses an actor architecture built on the
ractor framework. So I just added an actor
that periodically gathers Rust memory metrics (and some others while I was
there), and then logs them as key=value pairs that I can scrape and plot.
I ended up gathering three kinds of metrics, giving us programmatic versions of
what Activity Monitor and vmmap show:
- Whole-task
totals,
from calling the
task_infosyscall with theTASK_VM_INFOflavor, via the mach2 crate. These mirror Activity Monitor's numbers (memory footprint, resident size, graphics memory etc.). - Per-tag region census, from traversing the process's VM map with
mach_vm_region_recurseand bucketing each region by its VM tag. These reproducevmmap's "REGION TYPE" table (IOSurface, CoreMedia, Memory Tag 253, etc.). - Per-zone malloc
statistics,
from
malloc_get_all_zonesandmalloc_zone_statistics. These givevmmap's "MALLOC ZONE" table, including live bytes and block counts formurlet_rust.
Here's what these metrics look like when logged (census fields are region count / dirty megabytes):
14:03:22.394  INFO Actor: main::memory_logger: Memory census: regions_walked=30233 iosurface=188/386mb ioaccel=12255/749mb videobitstream=0/0mb cm_xpc=0/0mb cm_rpc=0/0mb cm_memorypool=29/1mb cm_readcache=0/0mb cm_crabs=0/0mb cm_regwarp=0/0mb cm_hls=0/0mb malloc=53/215mb stack=185/3mb tag253=5967/216mb tag255=11273/12mb tag0=224/6mb elapsed_ms=63     id="0.1" name="memory_logger"
14:06:22.327  INFO Actor: main::memory_logger: Memory totals: footprint_mb=3434 footprint_peak_mb=4205 resident_mb=1195 compressed_mb=15 internal_mb=985 graphics_mb=2745 regions=30204 rust_live_mb=16 rust_blocks=43759     id="0.1" name="memory_logger"
Don't be alarmed by the large graphics numbers: this is the steady-state cost of decoding nine camera streams, and these values are flat over time.
Here's the murlet_rust zone's live bytes over a 22-hour run:
23MB grows to 146MB, at approximately 5 MB/hour. We have a leak.
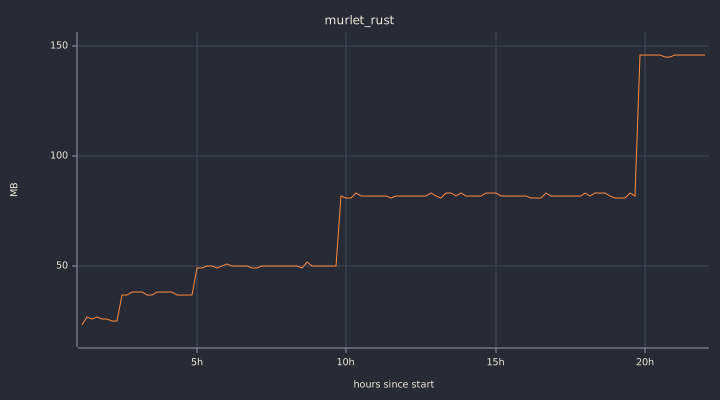
The staircase shape, with each step twice the size of the last, looks suspiciously like a vector being resized...
Finding the leak
Now we need to find which code is responsible for allocating the leaking memory. This is boringly straightforward because the Rust heap is now an ordinary malloc zone that can be inspected by the standard macOS debugging tools.
First we start Murlet with full stack logging:
$ MallocStackLogging=1 /Applications/Murlet.app/Contents/MacOS/MurletNext we let Murlet run for 30 minutes or so, and then we query its heap for any
allocation of at least a megabyte. Fortunately, there's just one such
allocation in the murlet_rust zone:
$ heap $PID -addresses '.*[1m+]'
[...]
0xc39000000: non-object in zone murlet_rust_0x10e698000 (33554432 bytes)
Finally, we look at the history of this particular allocation:
$ malloc_history $PID 0xc39000000
[...]
VM_ALLOC 0xc39000000-0xc397fffff [size=8388608]:  0x1825aac1c (libsystem_pthread.dylib) thread_start | 0x1825afc58 (libsystem_pthread.dylib) _pthread_start | 0x10fae267c (libmurlet.darwin-arm64.node) _RNvNvMs0_NtNtNtCsaLOjE9VYtxK_3std3sys6thread4unixNtB7_6Thread3new12thread_start | 0x10faf4fe4 (libmurlet.darwin-arm64.node) core::ops::function::FnOnce::call_once$u7b$$u7b$vtable.shim$u7d$$u7d$::h98fcc8a0db9e9237 | 0x10faf3e84 (libmurlet.darwin-arm64.node) std::sys::backtrace::__rust_begin_short_backtrace::hc35dc129a6894fe9 | 0x10fb03c28 (libmurlet.darwin-arm64.node) tokio::runtime::task::raw::poll::hef21ccbb927eb4b6 | 0x10fb0ee84 (libmurlet.darwin-arm64.node) tokio::runtime::scheduler::multi_thread::worker::run::ha9faf2e2f32456d0 | 0x10fb11140 (libmurlet.darwin-arm64.node) tokio::runtime::scheduler::multi_thread::worker::Context::run_task::h400e179067fd5d00 | 0x10f7610a8 (libmurlet.darwin-arm64.node) tokio::runtime::task::raw::poll::h1f21488cb6e6bbdc | 0x10f80fd74 (libmurlet.darwin-arm64.node) _$LT$tracing..instrument..Instrumented$LT$T$GT$$u20$as$u20$core..future..future..Future$GT$::poll::h8adaa44ecb0203b9 | 0x10f7b6d78 (libmurlet.darwin-arm64.node) ractor::actor::ActorRuntime$LT$TActor$GT$::processing_loop::_$u7b$$u7b$closure$u7d$$u7d$::_$u7b$$u7b$closure$u7d$$u7d$::h2f3158dcd6b33215 | 0x10f9e52d0 (libmurlet.darwin-arm64.node) _$LT$pipeline..actor..CameraPipelineActor$u20$as$u20$ractor..actor..Actor$GT$::handle::_$u7b$$u7b$closure$u7d$$u7d$::h3417ee7abf4abdbc | 0x10f9fcca4 (libmurlet.darwin-arm64.node) pipeline::actor::CameraPipelineState::process_queue_inner::hfff498e19554538a | 0x10fab4de8 (libmurlet.darwin-arm64.node) rescaler::Rescaler::render::hb284f42963a71177 | 0x10fb877f4 (libmurlet.darwin-arm64.node) _$LT$wgpu..backend..wgpu_core..CoreDevice$u20$as$u20$wgpu..dispatch..DeviceInterface$GT$::create_texture::h0c9f3620d92dc43c | 0x10fc3a574 (libmurlet.darwin-arm64.node) wgpu_core::device::global::_$LT$impl$u20$wgpu_core..global..Global$GT$::device_create_texture::hfdef2afe9f48bd30 | 0x10fc8fbe4 (libmurlet.darwin-arm64.node) wgpu_core::registry::FutureId$LT$T$GT$::assign::hf59e8fec70d3212e | 0x10feb57dc (libmurlet.darwin-arm64.node) alloc::raw_vec::RawVecInner$LT$A$GT$::reserve::do_reserve_and_handle::hd4458fea1d3fcd66 | 0x10feb56f4 (libmurlet.darwin-arm64.node) alloc::raw_vec::RawVecInner$LT$A$GT$::finish_grow::hd58298a5d62e1af5 | 0x1823db6f8 (libsystem_malloc.dylib) _malloc_zone_realloc | 0x1823cbeac (libsystem_malloc.dylib) xzm_realloc | 0x1823cb458 (libsystem_malloc.dylib) _xzm_malloc_large_huge | 0x1823b4894 (libsystem_malloc.dylib) xzm_segment_group_alloc_chunk | 0x1823b6cb8 (libsystem_malloc.dylib) _xzm_segment_group_alloc_segment | 0x1823b3ab8 (libsystem_malloc.dylib) _xzm_range_group_alloc_anywhere_segment | 0x18256ba64 (libsystem_kernel.dylib) mach_vm_map
Cleaning this up a bit, we have the following call stack:
rescaler::Rescaler::render
└ wgpu::Device::create_texture
  └ wgpu_core::global::Global::device_create_texture
    └ wgpu_core::registry::FutureId::assign
      └ alloc::raw_vec::RawVecInner::finish_grow
        └ malloc_zone_realloc
Hello FutureId.
Fixing the leak
Some background: the FutureId in our stack is a texture id in the process of
being assigned. Texture ids come from an
id allocator
that contains both a free list and a next_index:
pub(super) struct IdentityValues {
    free: Vec<(Index, Epoch)>,
    next_index: Index,
    // ...
}
If the free list is empty, next_index is used as the id (and then bumped).
Released ids are returned to the free list. Each texture is then stored in a
vector indexed by its id. This is the vector that keeps growing.
The bug: Texture creation is not the allocator's only client. wgpu v30 also
prepares an id before asking the surface for a texture. In cases where the
acquire
fails
or
returns without a texture,
the prepared id is dropped without being returned to the id allocator, so it
becomes unavailable for reuse. Murlet's presentation is driven by a
CADisplayLink callback, which keeps firing even when the window is covered, so
hitting the error path just requires a covered window (!). This causes us to
leak texture ids at the display rate (about 60 per second).
Interestingly, the leaked ids themselves don't increase the size of the vector.
They drain the id allocator's free list and then keep incrementing next_index,
so every successful texture creation is given an ever-higher index, and these
allocations grow the vector. This is why the malloc_history stack pointed at
the (innocent!) rescaler::Rescaler::render, instead of the error path.
The fix (wgpu#10184) is
straightforward: a Drop implementation on FutureId that returns the id to
the free list. On successful assign we "defuse" the Drop with mem::forget.
It's merged into the v30 branch, but the bug is still present in the latest
crates.io release, v30.0.1, so Murlet builds against a fork with the fix
applied. (A refactor has already removed the bug from wgpu's trunk.)
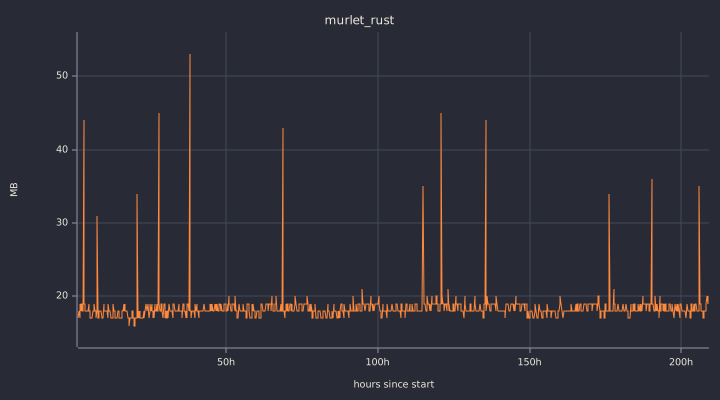
With the fix in place, the same series is flat at ~18MB over a 208-hour run (the spikes are only transient; I still need to investigate why they're happening).
Conclusion
Slow, unbounded growth in data structures, especially in third-party
dependencies, is the stuff of reliability nightmares. Rust is not a panacea
here: nothing prevents us from continually appending to a Vec. But we can see
this particular beast coming by logging memory usage and checking for a flat
line as part of our pre-release soak test. And if we build on macOS libmalloc
rather than bundling an allocator, we get powerful tooling for tracking down the
cause of any "up-and-to-the-right" lines. Murlet's Rust heap has now been flat
for over a week of continuous recording.